Category Archives: General

ISA tooling developed for the metabolomics community

A new set of ISA software tools have been developed out of the EU H2020 PhenoMeNal: Large-Scale Computing for Medical Metabolomics project, which we introduced in this earlier blog post.

The 2018-02 release of PhenoMeNal, also known as “Cerebellin”, was released end of February 2018. It represents a major upgrade to the 2017-08 production release. It has a richer set of tools, depends on improved deployment software, includes improved workflows for Mass Spectrometry (MS) and Nuclear Magnetic Resonance (NMR) data, and strengthens massively the resilience infrastructure deployments under high load. PhenoMeNal comprises of cloud-based portal infrastructure that includes the Galaxy workflow system customised to run on the Kubernetes container orchestrator, with Galaxy tools running their processing in Docker containers in the cloud. PhenoMeNal, and thus our new ISA Galaxy tools, work in Galaxy running various cloud-computing infrastructures including Amazon Web Services, Google Cloud PlatformMicrosoft Azure, OpenStack and KVM.

The ISA team has been contributing to the project since 2015, and has been collaborating on the development of user-facing, cloud-based data management and processing infrastructure in the project. The Cerebellin release of the PhenoMeNal software includes a new set of ISA-related Galaxy workflow tools, as well as native support for the ISA-Tab format in Galaxy. The tools work with the MetaboLights database as well as with ISA-Tab studies uploaded directly into the Galaxy platform, and builds on the Python ISA-API.
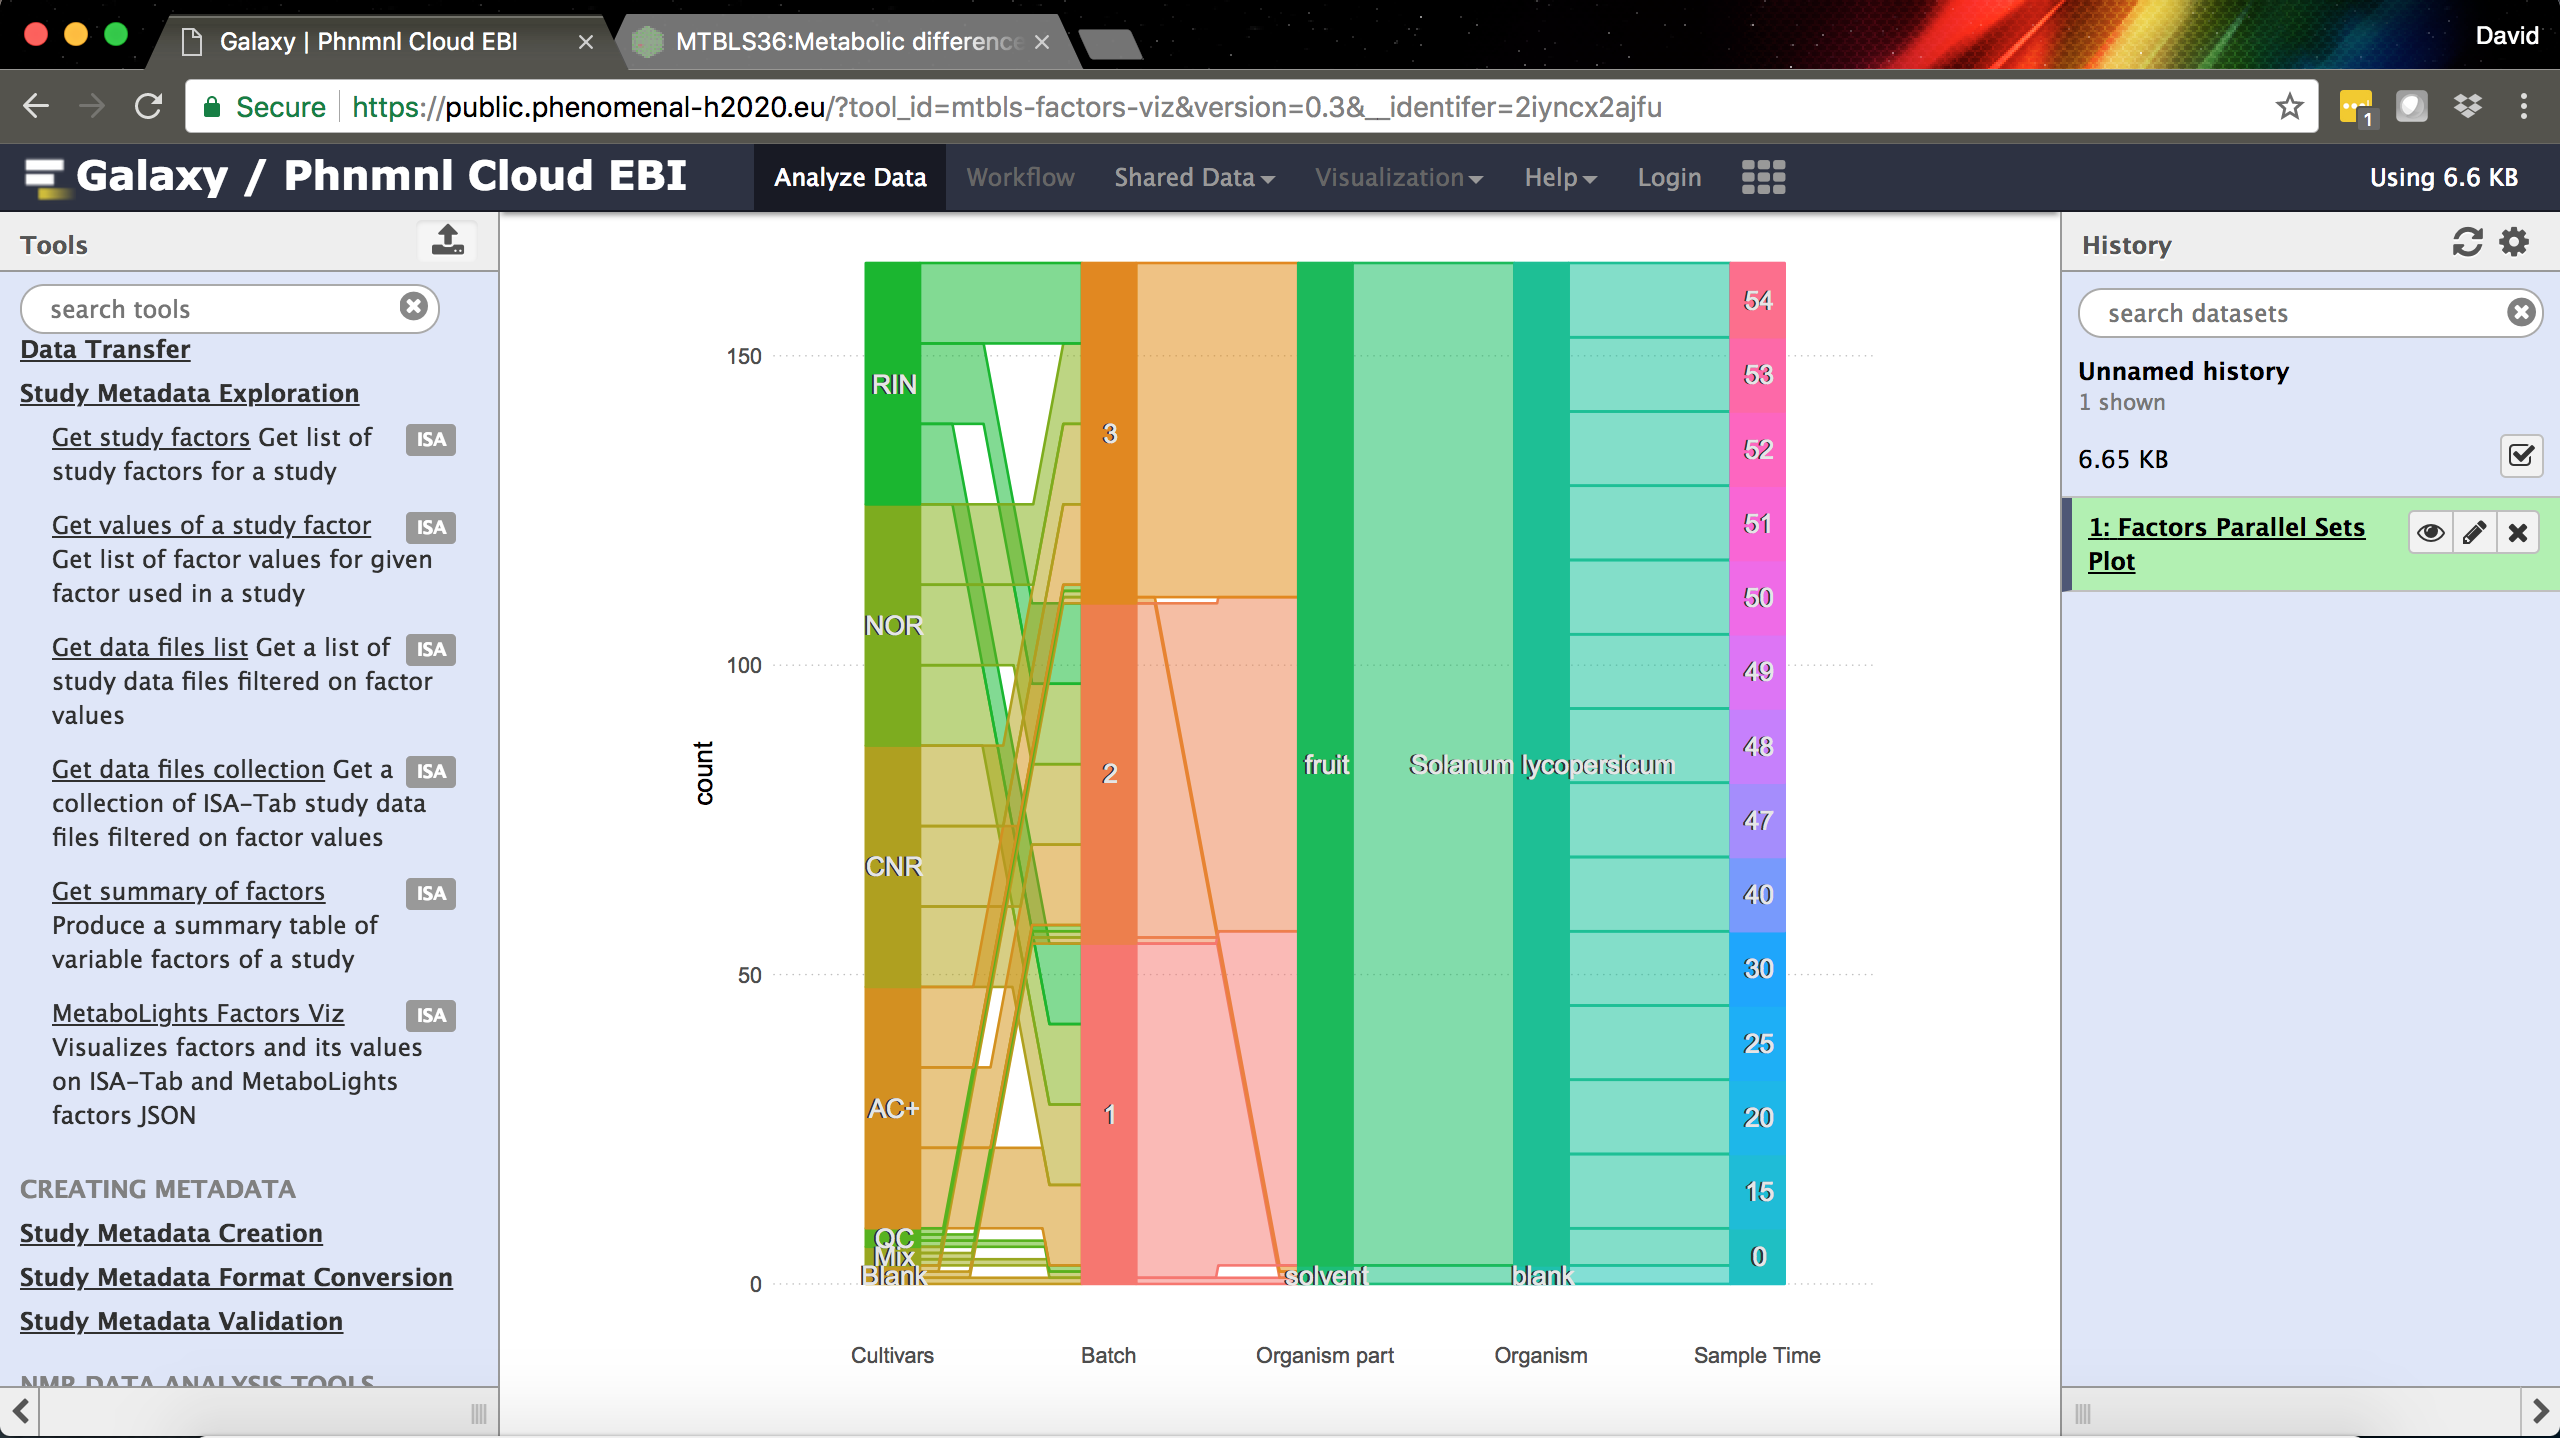
The MetaboLights/ISA-Tab Factors Visualization tool in Galaxy.

The MetaboLights/ISA-Tab Factors Visualization tool in Galaxy.

The new ISA Galaxy tools include:

  • Metabolights downloader (W4M), developed with our colleagues at CEA, downloads MetaboLights studies in the new Galaxy “isa-tab” data type.
  • Study Metadata Exploration tools (5 different tools) that allows querying over ISA-Tab data based on study factor slicing.
  • MetaboLights Factors Viz – a tool developed with our colleagues at EMBL-EBI for visualizing a summary of study factors as a parallel sets plot.
  • Format conversions from ISA-Tab (using the “isa-tab” Galaxy data type) to ISA-JSON and to W4M (developed by CEA).
  • ISA-Tab validation, again using the “isa-tab” Galaxy data type.
  • mzml2isa and nmrml2isa – Automated study metadata creation in ISA-Tab using the “isa-tab” Galaxy data type, from mlML and nmrML data, developed with our colleagues at the University of Birmingham.
  • And finally, an interactive tool to create prospective ISA-Tab study templates as “isa-tab” Galaxy data types, based on study design information. This tool supports generating assays for both MS and NMR, using standardised file naming templates compatible with Phenome Centre Birmingham and the MRC-NIHR National Phenome Centre at Imperial College London. The tool shares curation practices with those used by the MetaboLights database and implements the Metabolomics Standards Initiative (MSI) reporting guidelines that go towards making metadata and data FAIR.

We are also developing extensions to our Galaxy tools to support NGS and DNA microarray data, and to enable direct deposition to public repositories, such as those hosted by EMBL-EBI, via Galaxy workflows.

You can try out our ISA Galaxy tools in the Cerebellin release of PhenoMeNal in the public PhenoMeNal Galaxy server. The next scheduled release of PhenoMeNal will be the Dalcotidine release scheduled for August 2018.

ISAcreator 1.7.11 now available

Today we announce the release of ISAcreator 1.7.11.

This release updates ISAcreator to work with Java 9.

You can download ISAcreator 1.7.11 from Github here: https://github.com/ISA-tools/ISAcreator/releases/tag/v1.7.11

If you’re an ISAcreator user, or use any of the other ISA-tools suite, please let us know and we can list you as being part of the ISAcommons community.

If you have any questions or any problems with using ISAcreator, please drop the ISA Team an email to isatools@googlegroups.com or to the ISA community forum.

Plant Science takes a focus on ISA

Back in April this year, Dr David Johnson from the ISA team gave a presentation on “Data Infrastructures to Foster Data Reuse” at a workshop on Integrating Large Data into Plant Science: From Big Data to Discovery hosted by GARnet (the UK network for Arabidopsis researchers) and Egenis (the Exeter Centre for the Study of the Life Sciences). The workshop was held at Dartington Hall in Devon, South West England, and was well attended by researchers from the plant and biological science community worldwide as well as representatives from industry from organisations such as Syngenta.

David presented on ISA, as well as on biosharing.org, as candidate data infrastructure resources for enabling data reuse in the plant sciences, as well as presenting an example of how one might encode high-throughput plant phenotyping in ISA tab.

We have observed the uptake of the ISA tab format across the broad range of life sciences, but view its adoption, with a view to making data FAIR (Findable, Accessible, Interoperable and Reusable), in the plant sciences as essential for the field. In particular centres such as the UK’s National Plant Phenomics Centre in Aberystwyth, Wales, could benefit hugely from adopting ISA where there are emerging challenges in data management, in particular as automation of data collection is a significant driver in modern plant-based research and agritech.

There are also existing data analysis platforms such as Araport (the Arabidopsis information Portal), TAIR (The Arabidopsis Information Resources) and BioDare (Biological Data Repository) that could benefit from standardizing their experimental data, as well as ongoing efforts to create open data resources in the plant sciences, such as the Collaborative Open Plant Omics (COPO) project, that will be using the new ISA JSON format as native data objects.

You can check out David’s presentation on SlideShare.

Compared to what? The ArrayExpress Atlas.

This is intended to be a constructive criticism of a resource which I believe to have the potential to be powerful and useful.

Any of you who have read Edward Tufte’s essay on Visual and Statistical Thinking: Displays of Evidence for Making Decisions will instantly recognise this question…compared to what? We see many examples in the biological world, and I’ll focus specifically on one resource here…the ArrayExpress Atlas. First, a disclaimer: I used to work in the group who developed this resource, and have aired my criticisms many years ago to no avail. And not only me, senior researchers have raised the same questions even before the resource was developed, but all suggestions have up to now been ignored.

Here, I will only give food for thought about what is presented in the Atlas since some people don’t seem to understand that what is presented doesn’t actually make much sense. This is mostly caused by a failure to answer the compared to what question…a particularly important question for a resource which is comparing gene expression levels would you not say?

Some examples:

The heatmap
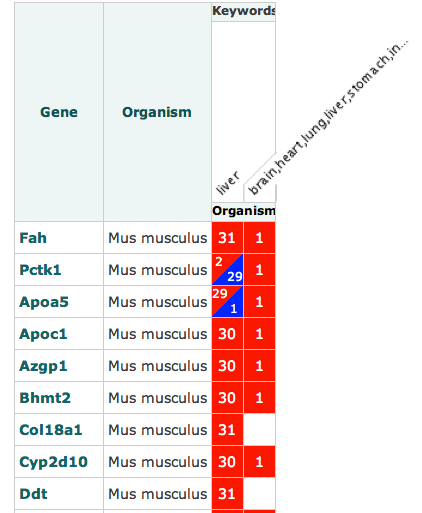
A query on the resource, such as this will yield a result like so:

My first thought would be that this heat map is telling me that Fah was up regulated in liver 31 times and once in some obscure string seemingly encompassing every organism in the human body (I’ll get to my criticism about these factor representations later). Now, the second question that any self-respecting investigator would ask is compared to what? Is this saying that it is up regulated compared to normal tissue, diseased tissue or all tissue across all organisms? Actually, we don’t know. And there is nothing to say what is being shown here. Moreover, what does it mean to say up and down regulated. Surely it depends. You can’t just present discrete variables, one needs to show the statistical meaning of such suggestions…i.e. show the P value of up/down regulations since not all may be meaningful to a biologist/statistician even though they may well be to guys in the ArrayExpress Atlas team.

Another small point on this is that if this value is dependent on database contents rather than baseline expression levels (whatever they are supposed to be), then if my database contains more liver samples than anything else, and expression levels are calculated relative to this content, my results will be skewed. Either a disclaimer should be presented on the site, or they should make the comparison metrics used more obvious.

The expression profiles & factor display

Based on this page.

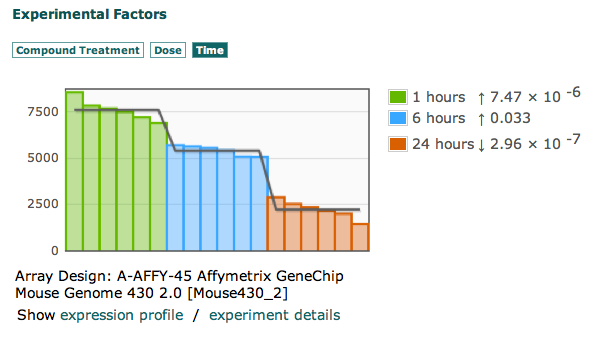
Look at this graph, and tell me what the Y-Axis represents. First of all, even if what they are trying to represent was meaningful, it would still be pretty useless. Let me explain. They have split up variables which are supposed to be related into 3 different tabs, with variables which make NO sense. What does it mean to show time as a variable. Time of what? Sampling time, the length of time an organism was exposed to a compound…what? Exactly, nothing. It means nothing to show time like this. What does it mean to show dose as a seemingly independent variable. Dosage is no good without a compound. What does make sense and can at least possibly allow one to ask the question “compared to what?”  is to show growth factor beta 1 and 5 ng/ml after 1 hour as one factor, and show the expression levels then (even though we still don’t know what the Y axis means). You can look at any experiment in the Atlas and find the same problems.

The cluster effect

All people, even those not in the realm of statistics need to understand the importance of the cluster effect. I.e. do I only get over expression of one or more genes when another gene is expressed/under expressed. Transcription networks are indeed networks. There are feedback loops, both positive and negative, and a lot is known about these loops already. So, why are these not taken into account when calculating statistics in the Atlas? For such cases, presenting mutually exclusive P-values of individual genes is not really enough and the clustering effects should be taken into account more so as to adjust the P-value to more realistic sizes.

Summary

I have presented my thoughts on the ArrayExpress Atlas publicly and internally beforehand, but this is the first time I’m airing it to the public domain. I hope now that something is done to fix this resource since I still believe it to have the potential to be cool and really helpful.