Category Archives: Web

Towards a new Sequence Logo Visualization

Diverging somewhat from our normal posts is a post about a new visualization developed in our group.

Eamonn is at EuroVis 2014 in Swansea this week where he will be presenting a paper viewable here Redesigning the Sequence Logo with Glyph-based Approaches to Aid Interpretation on the redesign of the infamous Sequence Logo, some screenshots which you can see below. It supports:

  1.  multiple sequence groups for comparison;
  2. entropy or frequency based encoding of bar size;
  3. glyphs to show changes in position preference for hydropathy or charge;
  4. GestaltLine glyph to show overview of variation at a position; and
  5. Customisation to:
    1. reduce transparency of positions where variability is high; or
    2. show the consensus sequence.
Screen Shot 2014-05-14 at 11.48.11

Sequence logo with entropy encoding.


Screen Shot 2014-05-14 at 11.49.17

Sequence logo with frequency based encoding and showing detail on demand view on position hover.


Everything, as always, is open source and available with examples on our GitHub repository

https://github.com/ISA-tools/SequenceLogoVis

. Let us know what you think, what should be improved, etc. via our issue tracker. The paper is available here and the presentation will be online soon!

ISAcreator available in GenomeSpace

ISAcreator has supported access to GenomeSpace since release 1.7.0. and it is now also available through the GenomeSpace online interface.

GenomeSpace is a framework supporting cloud-based interoperability of genomics analysis tools. By providing access to multiple tools through their interface, and supporting file transfers in the cloud, GenomeSpace provides a bridge among the tools, allowing users    Some of the tools available through GenomeSpace are: CytoscapeGalaxyGenePatternGenomicaIntegrative Genomics Viewer (IGV), and the UCSC Genome Table Browser. Find out more about what is GenomeSpace and what GenomeSpace can do for you.

I will now describe the functionality ISAcreator supports for GenomeSpace.

You can launch ISAcreator from your desktop or you can launch it once you are logged in to GenomeSpace (after registering to their service). For launching ISAcreator from within GenomeSpace, just hover over the ISAcreator icon and select ‘Launch’:

GS-8

If you launch ISAcreator from GenomeSpace, you will be prompted to download ISAcreator and will see the following pop-up window (after you accept to download the file):

GS-10

When running ISAcreator (either from your desktop or following the GenomeSpace route), you will notice that it now has a third mode of operation (apart from the previously available light and normal modes) that corresponds to GenomeSpace. With this third method of operation, ISAcreator supports opening ISA-TAB files stored on the cloud environment provided by GenomeSpace and also, saving files into GenomeSpace storage facilities.

GS-7

If you choose the GenomeSpace mode, you will have to enter your GS user credentials in the ISAcreator login page:

GS-3

Then you will load the configuration files, as usual, and get to the main menu where you can choose to load an existing ISA-TAB file. If it is not the first time you are loading files, you will see the previously loaded files and also have the option to search GenomeSpace for more files:

GS-11

As an example, you can find the publicly available BII-I-1 ISA-TAB dataset in GenomeSpace under Public/agbeltran/ISA-TAB-datasets, and select it to load:

GS-12

After loading an ISA-TAB dataset, you can save it to GenomeSpace (even if it is a local dataset that you want to store in GenomeSpace):

GS-13

GenomeSpace also provides documentation about ISAcreator in this page and a guide about using ISAcreator in this other page.

As always, send us comments or questions contacting:

  • the ISA team at isatools [at] googlegroups [dot] com, 
  • the ISA user forum at isaforum [at] googlegroups [dot] com

or send us feature requests or bug reports through the issue tracker in Github:

  • https://github.com/ISA-tools/ISAcreator/issues

Introducing OntoMaton – Ontology Search & Tagging for Google Spreadsheets

We are happy to announce the release of OntoMaton, a tool which allows users to search for ontology terms and tag free text right in Google Spreadsheets. This post will serve to introduce you to the tool, how it works and how it can make it easier for users to use ontologies in a pervasive, powerful and collaborative environment, complementing existing work from our team in the creation of ISAcreator.

How it looks

OntoMaton is available from the Google Script Gallery and when installed provides a menu as shown below.

From the menu you may access two resources part of OntoMaton: ontology search and ontology tagging. There is also an ‘about’ option.

Ontology Search

Ontology Tagging

Behind the scenes: restricting the ontology search space

If a sheet named “restrictions” is in your spreadsheet, OntoMaton will consult it to determine if the currently selected column/row name has a narrowed ontology search space. This makes it quicker to search BioPortal, allows for restriction of the user’s result space to make easier the process of selecting a term.

Behind the scenes: extra information about the terms you select

For every term you select, it’s full details are recorded in a “terms” sheet. This makes it possible to use OntoMaton in any spreadsheet and all provenance information (including URIs, ontology source and version) for selected ontology terms will be immediately available for use when exposing your records to the linked data world!

Installing

To install, create a new google spreadsheet, then go to the menu tools > script gallery. In the script gallery, search for ontology or ontomaton and you’ll get the following result pane.

Click on ‘install’ and this will install the scripts inside your spreadsheet. Then there is one more and final step to follow for installation. You have to click again on tools > script manager and you’ll be presented with something like that shown in the image below.

OntoMaton contains lots of functions, but the only one you need to worry about in order to run the program is the onOpen function. Click this then click on run and the OntoMaton menu will be installed in your menu bar. From here you’ll be able to access the ontology search and ontology tagging functions.

Let us know what you think! New releases will come soon to fix any problems you may identify, please submit all ‘bugs’ and feature requests through https://github.com/ISA-tools/OntoMaton/issues

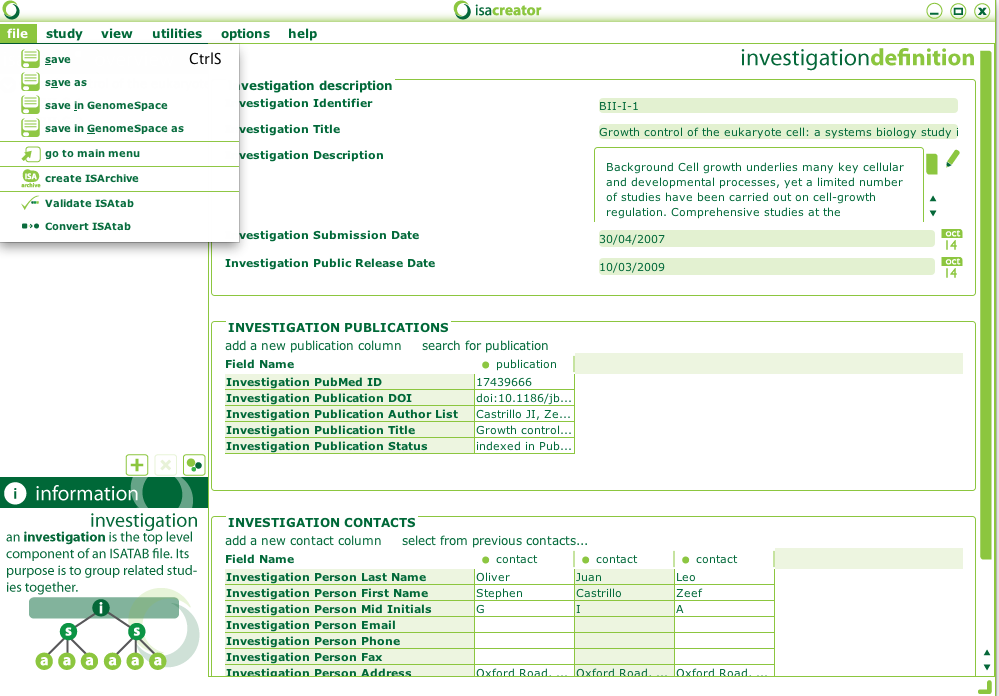
OntoMaton inherently supports ISA-Tab files too. So if you have an investigation file it will automatically add ontology sources to the ONTOLOGY SOURCE REFERENCE block. Also, if you have Term Source Ref and Term Source Accession after a column, OntoMaton will automatically populate these columns for you.

Also, the following table provides a quick review of available tools attempting to mix spreadsheets and access to vocabulary servers:

domain

automated

annotation

ontology search/lookup

versioning*

collaboration

RightField

general

ISA creator

multiomics

Proteome Harvest PRIDE

proteomics

Annotare

transcriptomics

OntoMaton

general

  • by versioning we refer to managing of user edits throughout the annotation process.

We hope you enjoy this new feature!

The ISA team

Addendum:

Safari 6 users, be aware you will have to activate the ‘developer menu’ from the Advanced Item in the Safari ‘Preferences’ menu item. Once activated, go to menu ‘Develop’ and navigate to ‘User Agent’ item and select ‘Safari 5.1.7’ for enabling the browser to work with Google Spreadsheet. (Thanks to rpyzh for reporting the issue, see here)

Compared to what? The ArrayExpress Atlas.

This is intended to be a constructive criticism of a resource which I believe to have the potential to be powerful and useful.

Any of you who have read Edward Tufte’s essay on Visual and Statistical Thinking: Displays of Evidence for Making Decisions will instantly recognise this question…compared to what? We see many examples in the biological world, and I’ll focus specifically on one resource here…the ArrayExpress Atlas. First, a disclaimer: I used to work in the group who developed this resource, and have aired my criticisms many years ago to no avail. And not only me, senior researchers have raised the same questions even before the resource was developed, but all suggestions have up to now been ignored.

Here, I will only give food for thought about what is presented in the Atlas since some people don’t seem to understand that what is presented doesn’t actually make much sense. This is mostly caused by a failure to answer the compared to what question…a particularly important question for a resource which is comparing gene expression levels would you not say?

Some examples:

The heatmap
A query on the resource, such as this will yield a result like so:

My first thought would be that this heat map is telling me that Fah was up regulated in liver 31 times and once in some obscure string seemingly encompassing every organism in the human body (I’ll get to my criticism about these factor representations later). Now, the second question that any self-respecting investigator would ask is compared to what? Is this saying that it is up regulated compared to normal tissue, diseased tissue or all tissue across all organisms? Actually, we don’t know. And there is nothing to say what is being shown here. Moreover, what does it mean to say up and down regulated. Surely it depends. You can’t just present discrete variables, one needs to show the statistical meaning of such suggestions…i.e. show the P value of up/down regulations since not all may be meaningful to a biologist/statistician even though they may well be to guys in the ArrayExpress Atlas team.

Another small point on this is that if this value is dependent on database contents rather than baseline expression levels (whatever they are supposed to be), then if my database contains more liver samples than anything else, and expression levels are calculated relative to this content, my results will be skewed. Either a disclaimer should be presented on the site, or they should make the comparison metrics used more obvious.

The expression profiles & factor display

Based on this page.

Look at this graph, and tell me what the Y-Axis represents. First of all, even if what they are trying to represent was meaningful, it would still be pretty useless. Let me explain. They have split up variables which are supposed to be related into 3 different tabs, with variables which make NO sense. What does it mean to show time as a variable. Time of what? Sampling time, the length of time an organism was exposed to a compound…what? Exactly, nothing. It means nothing to show time like this. What does it mean to show dose as a seemingly independent variable. Dosage is no good without a compound. What does make sense and can at least possibly allow one to ask the question “compared to what?”  is to show growth factor beta 1 and 5 ng/ml after 1 hour as one factor, and show the expression levels then (even though we still don’t know what the Y axis means). You can look at any experiment in the Atlas and find the same problems.

The cluster effect

All people, even those not in the realm of statistics need to understand the importance of the cluster effect. I.e. do I only get over expression of one or more genes when another gene is expressed/under expressed. Transcription networks are indeed networks. There are feedback loops, both positive and negative, and a lot is known about these loops already. So, why are these not taken into account when calculating statistics in the Atlas? For such cases, presenting mutually exclusive P-values of individual genes is not really enough and the clustering effects should be taken into account more so as to adjust the P-value to more realistic sizes.

Summary

I have presented my thoughts on the ArrayExpress Atlas publicly and internally beforehand, but this is the first time I’m airing it to the public domain. I hope now that something is done to fix this resource since I still believe it to have the potential to be cool and really helpful.