Author Archives: isatools

Toward interoperable bioscience data published in Nature Genetics

Our commentary, named “Toward interoperable bioscience data” has just been released in Nature Genetics. In it, we focus on working towards an ISA commons, where one day we’ll all be able to share our experimental metadata in one common, easy to use format, supporting minimal information checklists and ontologies (via the ISA-Tab format and respective tools).

The editor speaks about the paper, paraphrased here:

“Reformatting data is a full-time job for many researchers, even before the minimum reporting guidelines, terminologies and formats of each field are taken into consideration. In this issue, we present a Commentary and a Perspective suggesting solutions to these problems that have been developed by a process of community consultation and open review to which the journal was a party. In the Commentary, Susanna-Assunta Sansone and colleagues identify one central problem, namely that “most repositories are designed for specific assay types, necessitating the fragmentation of complex datasets,” and they offer a unified view of the metadata formatting that will be needed to ensure that biomedical research datasets become interoperable. This solution is the overarching ISA framework, where the acronym stands for ‘Investigation’ (the project context), ‘Study’ (a unit of research) and ‘Assay’ (analytical measurement) (p 121). This proposal shifts the sets of reporting standards agreed upon by each community into the infrastructure and formatting of the data files themselves. Sansone and colleagues also list a set of participant communities that can pioneer the approach and teach by example.”

Many thanks to all who contributed to the paper and to the growing success of ISA (commons and tools).

Compared to what? The ArrayExpress Atlas.

This is intended to be a constructive criticism of a resource which I believe to have the potential to be powerful and useful.

Any of you who have read Edward Tufte’s essay on Visual and Statistical Thinking: Displays of Evidence for Making Decisions will instantly recognise this question…compared to what? We see many examples in the biological world, and I’ll focus specifically on one resource here…the ArrayExpress Atlas. First, a disclaimer: I used to work in the group who developed this resource, and have aired my criticisms many years ago to no avail. And not only me, senior researchers have raised the same questions even before the resource was developed, but all suggestions have up to now been ignored.

Here, I will only give food for thought about what is presented in the Atlas since some people don’t seem to understand that what is presented doesn’t actually make much sense. This is mostly caused by a failure to answer the compared to what question…a particularly important question for a resource which is comparing gene expression levels would you not say?

Some examples:

The heatmap
A query on the resource, such as this will yield a result like so:
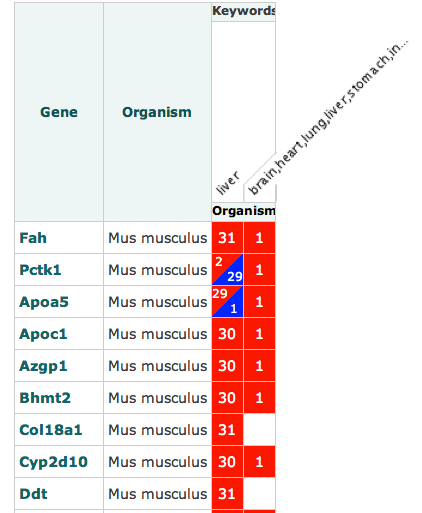
My first thought would be that this heat map is telling me that Fah was up regulated in liver 31 times and once in some obscure string seemingly encompassing every organism in the human body (I’ll get to my criticism about these factor representations later). Now, the second question that any self-respecting investigator would ask is compared to what? Is this saying that it is up regulated compared to normal tissue, diseased tissue or all tissue across all organisms? Actually, we don’t know. And there is nothing to say what is being shown here. Moreover, what does it mean to say up and down regulated. Surely it depends. You can’t just present discrete variables, one needs to show the statistical meaning of such suggestions…i.e. show the P value of up/down regulations since not all may be meaningful to a biologist/statistician even though they may well be to guys in the ArrayExpress Atlas team.

Another small point on this is that if this value is dependent on database contents rather than baseline expression levels (whatever they are supposed to be), then if my database contains more liver samples than anything else, and expression levels are calculated relative to this content, my results will be skewed. Either a disclaimer should be presented on the site, or they should make the comparison metrics used more obvious.

The expression profiles & factor display

Based on this page.
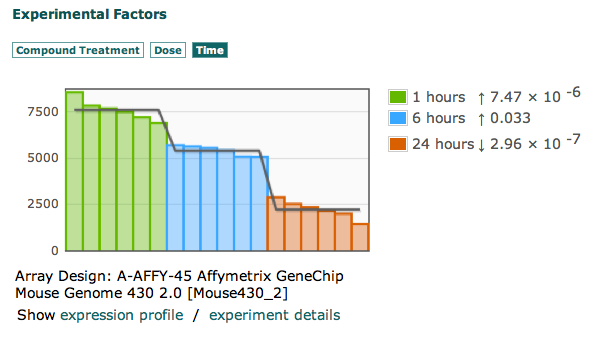
Look at this graph, and tell me what the Y-Axis represents. First of all, even if what they are trying to represent was meaningful, it would still be pretty useless. Let me explain. They have split up variables which are supposed to be related into 3 different tabs, with variables which make NO sense. What does it mean to show time as a variable. Time of what? Sampling time, the length of time an organism was exposed to a compound…what? Exactly, nothing. It means nothing to show time like this. What does it mean to show dose as a seemingly independent variable. Dosage is no good without a compound. What does make sense and can at least possibly allow one to ask the question “compared to what?”  is to show growth factor beta 1 and 5 ng/ml after 1 hour as one factor, and show the expression levels then (even though we still don’t know what the Y axis means). You can look at any experiment in the Atlas and find the same problems.

The cluster effect

All people, even those not in the realm of statistics need to understand the importance of the cluster effect. I.e. do I only get over expression of one or more genes when another gene is expressed/under expressed. Transcription networks are indeed networks. There are feedback loops, both positive and negative, and a lot is known about these loops already. So, why are these not taken into account when calculating statistics in the Atlas? For such cases, presenting mutually exclusive P-values of individual genes is not really enough and the clustering effects should be taken into account more so as to adjust the P-value to more realistic sizes.

Summary

I have presented my thoughts on the ArrayExpress Atlas publicly and internally beforehand, but this is the first time I’m airing it to the public domain. I hope now that something is done to fix this resource since I still believe it to have the potential to be cool and really helpful.

The MAGE to ISA converter takes an ArrayExpress…

The MAGE to ISA converter takes an ArrayExpress accession and converts it’s associated MAGE-TAB file to ISAtab.

Enter a valid ArrayExpress accession, e.g. E-BUGS-65 to get it’s ISAtab counterpart.

In doing this conversion, this code also cleans up the MAGE-TAB to remove redundant columns, normalise the data structures (split SDRF into a study sample file and assay file) and infer the technologies used in an
experiment.


Please test it out and let us know which experiments do not convert for you by emailing us at isatools@googlegroups.com

Disclaimer
This is a beta version. Sometimes the conversion will not work as expected since the files served from ArrayExpress may contain some errors. We can detect and clean most of these errors, but for inference of information such as the measurement being observed and the technology used, it can be very difficult since the MAGE-TAB files may have inconsistent annotations or don’t specify the measurement being performed at all.

Creating an ISAcreator WebStart application

One of the advantages of creating a webstart application is that it’s pretty much point and click. From a browser page, users can gain access to your Java tool relatively quickly.

To deploy a JNLP version of ISAcreator within your organisation, you should follow the following steps…

1. Get the ISAcreator Jar file you wish to expose via the web.
2. You need to digitally sign the Jar file using a jarsigner. there are two steps to this process:
a. Create your key store with an alias (name) using keytool
keytool -genkey -keystore isatools-keys -alias ISAcreator
b. Sign the ISAcreator jar file using the key you have just generated
jarsigner -keystore isatools-keys ISAcreator-1.3.1.jar ISAcreator

3. Create a JNLP file describing the tool and where the Jar file is located, replacing the baseurl text with the URL of where the ISAcreator.jnlp file etc. are located :

  1. <?xml version="1.0" encoding="utf-8"?>
  2. <jnlp spec="1.0+" codebase="baseURL" href="ISAcreator.jnlp">
  3. 	<information>
  4. 		<title>ISAcreator 1.3</title>
  5. 		<vendor>ISAtools team, University of Oxford, UK</vendor>
  6. 		<homepage href="http://isatools.org" />
  7. 		<description>ISAcreator</description>
  8. 		<version>1.3</version>
  9. 		<icon href="baseURL/isacreator_logo.jpg"/>
  10. 		<offline-allowed/>
  11. 	</information>
  12. 	<security>
  13. 		<all-permissions/>
  14. 	</security>
  15. 	<resources>
  16. 		<j2se version="1.5+" />
  17. 		<jar href="baseURL/ISAcreator-1.3.1.jar" />
  18. 	</resources>
  19. </jnlp>
  20. 
    

Now deploy the files to your web server of choice and link to the JNLP file to allow users to download ISAcreator to their machine. An example instance is running at: http://www.antarctic-design.co.uk/isacreator/ISAcreator.jnlp

New developments: publication search UI improvements

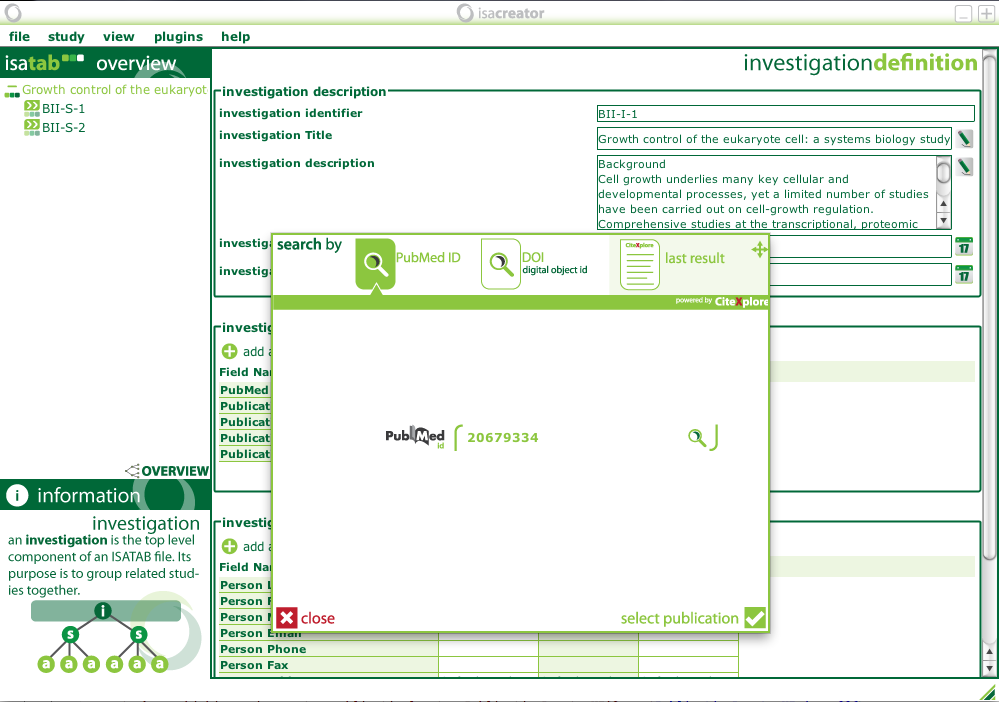
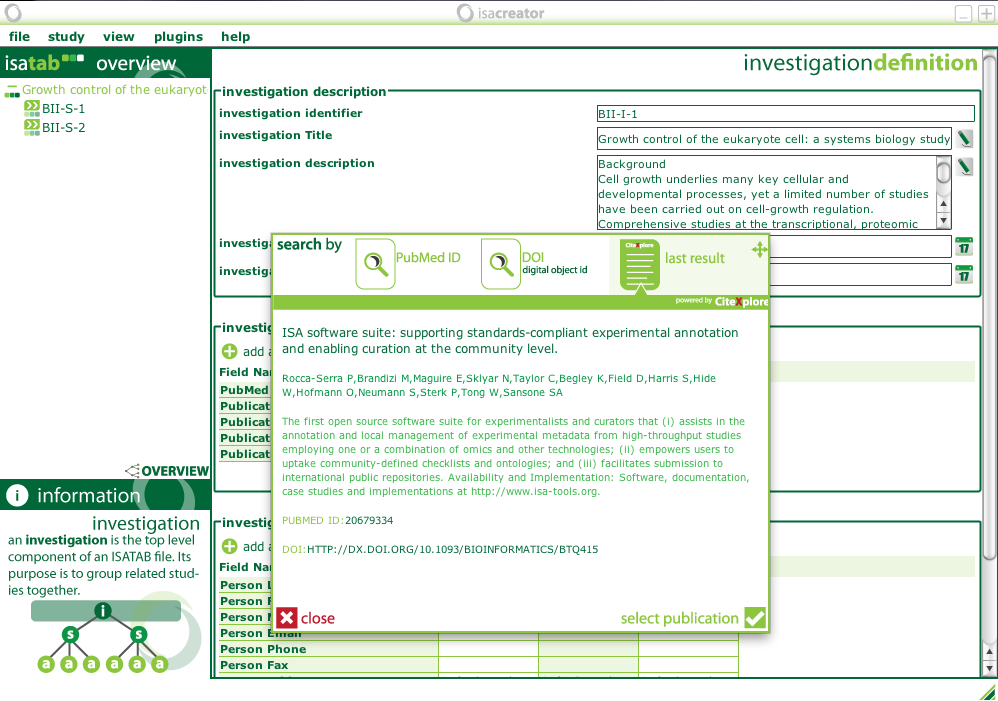
I’ve never really liked the Publication locator utilities user interface much, so whilst at BioCurator, in the spare time I had, I redid the interface to make it clearer, faster and more informative to users. The result of the improvements are shown in the screenshots below!

Search by pubmed id – like the last version, only nicer 🙂


Publication information is now clearer, and you can easily access a previous search via the last result button in the top panel.

I might make some more improvements to the UI in the next few hours, but for now I think it’s much better than it was!

New developments: Transposed spreadsheet views in ISAcreator…

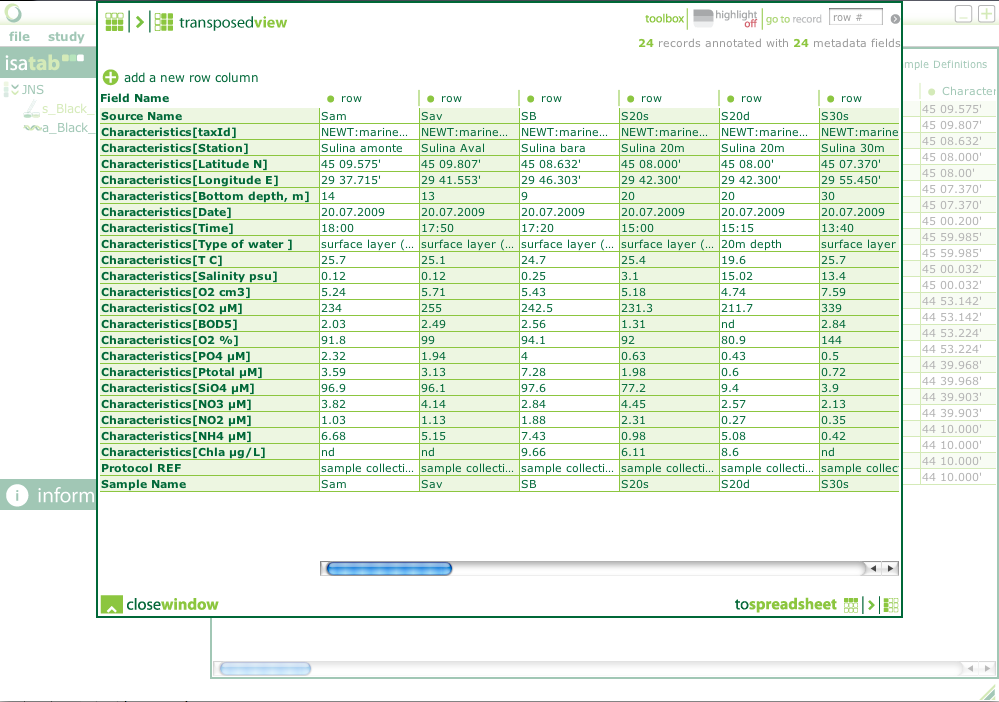
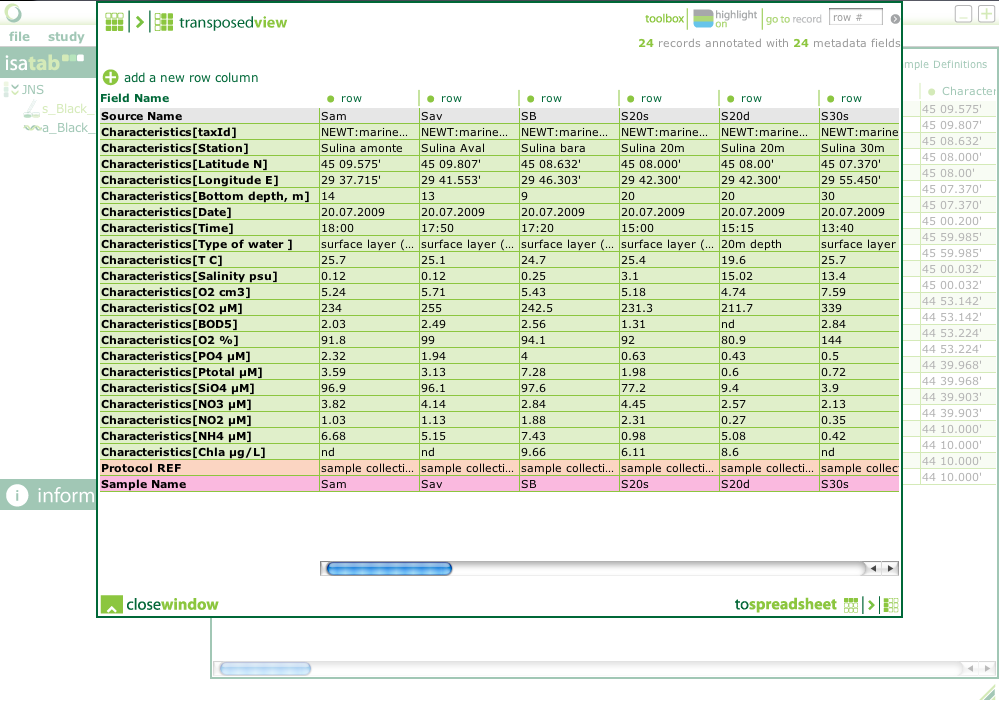
Some of our collaborators, especially those annotating samples with a lot of information told us that the standard spreadsheet view we presented in ISAcreator didn’t work so well when trying to annotate their data. So….we decided to add a transposed view to the spreadsheet, essentially flipping the spreadsheet around to make it easier for people to enter information.

Transposed Spreadsheet


Highlight the different types of data to be entered, making it easier to disseminate between different data entry fields.

The feedback we’ve received so far from users at GSC10 (http://gensc.org) and BioCurator have been extremely positive. This is yet another feature added from receipt of user feedback! Let us know what you think we’re missing and we’ll do our best to serve your needs providing there is enough interest from the community!

Browse & search OLS and BioPortal Seamlessly with ISAcreator and ISAcreator configurator

For browsing and querying OLS and BioPortal seamlessly, ISAcreator and it’s associated configurator have done much to make life easier for it’s users.

ISAcreator configurator and it’s use for ontologies

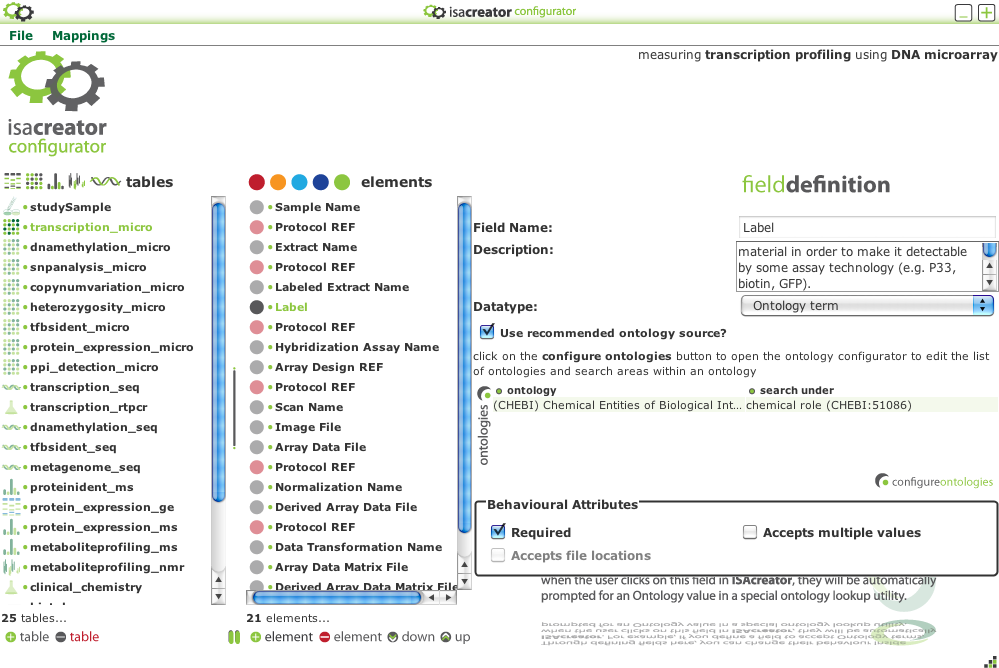
ISAcreator Configurator is a tool used by community experts or curators to detail the Minimum Information (via MIBBI for instance) that users should enter to describe their experiment. As part of this, curators can define which fields (e.g. Sample Name) are required, whether or not they require ontology terms and if so, which ontologies (and parts of the ontologies) users should be pointed to.

ISAcreator Configurator – allows curators to define ‘checklists’: these are the fields required to describe an experiment from start to finish.

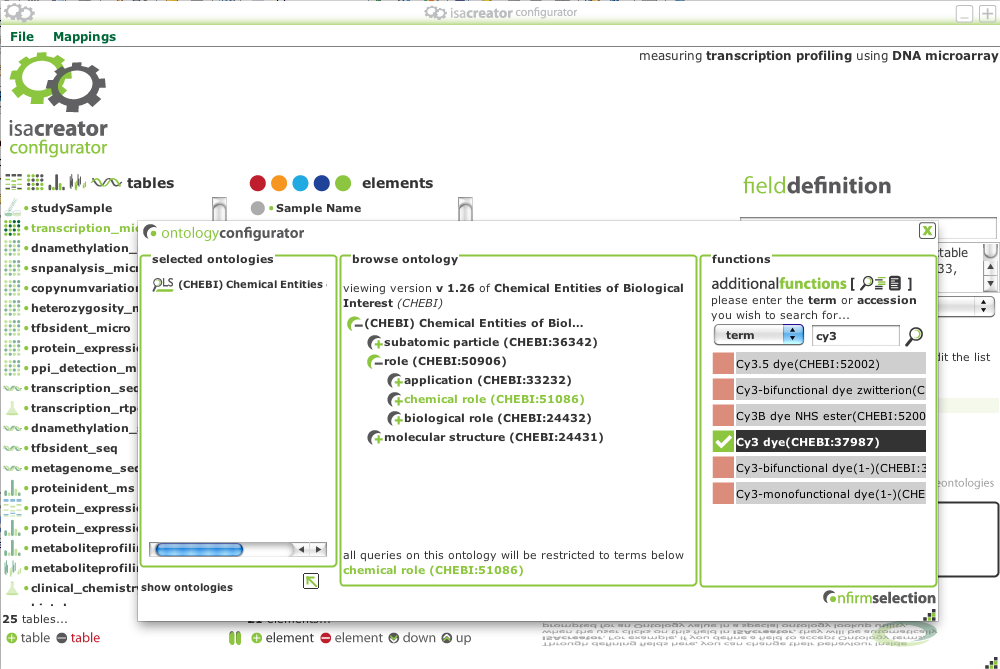
The ISAcreator configurator provides both the ability to browse ontologies and to search them, so as to allow curators to select which ontologies and which parts of these ontologies should be suggested to users whenever they annotate a field in the ISAcreator.

Browsing ontologies

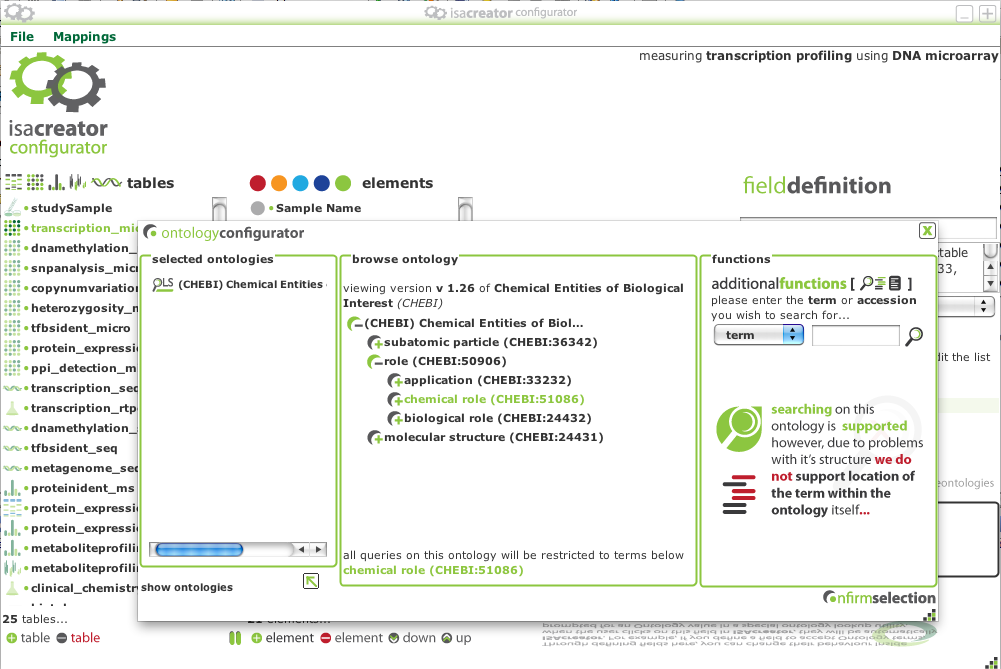
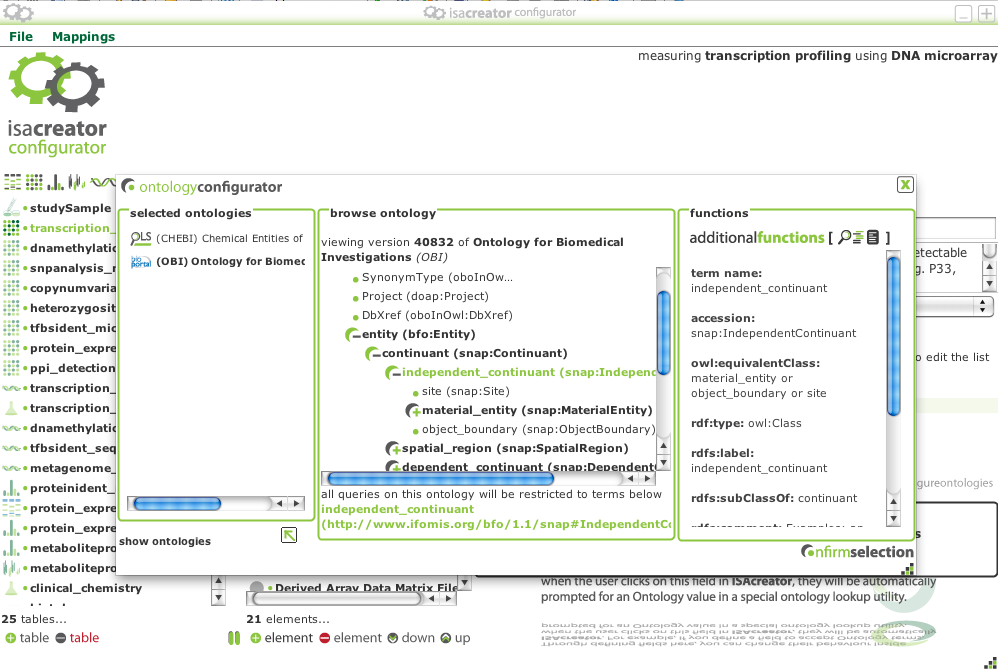
Users can browse ontologies in OLS and BioPortal via an easy to use GUI. The browsing is done on the fly by accessing hierarchy web services from both the OLS and BioPortal. An extensible code base means that other ontology resource (should they become available) can be added at any point.

Browse ChEBI from OLS

Browsing OBI (Ontology for Biomedical Investigations) from BioPortal

Search within ontologies

Search within ontologies

Users can search within ontologies and then locate the ontology in the entire ontology hierarchy. This functionality is provided to aid curators in finding the appropriate branch of an ontology to restrict users to.

ISAcreator and how it makes ontology selection easier for users

ISAcreator is a tool used by the community who often don’t know much about ontologies or the minimum information required to describe an experiment. The ISAcreator configurator produces XML describing the minimum information and the ontologies to use so that users need not worry about what to enter.

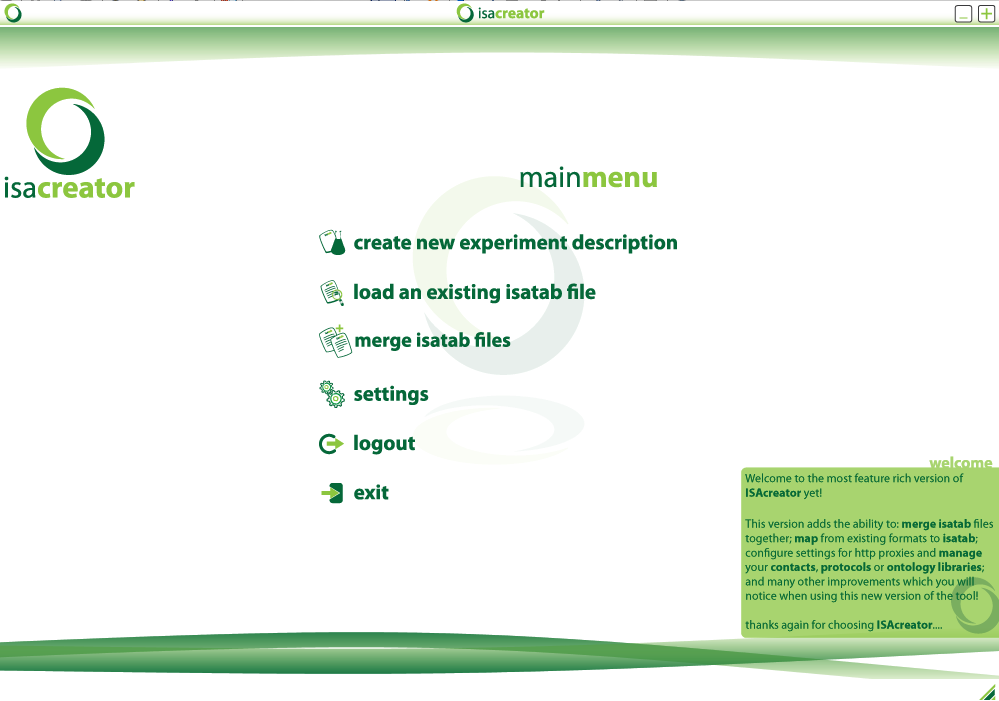
ISAcreator’s main menu

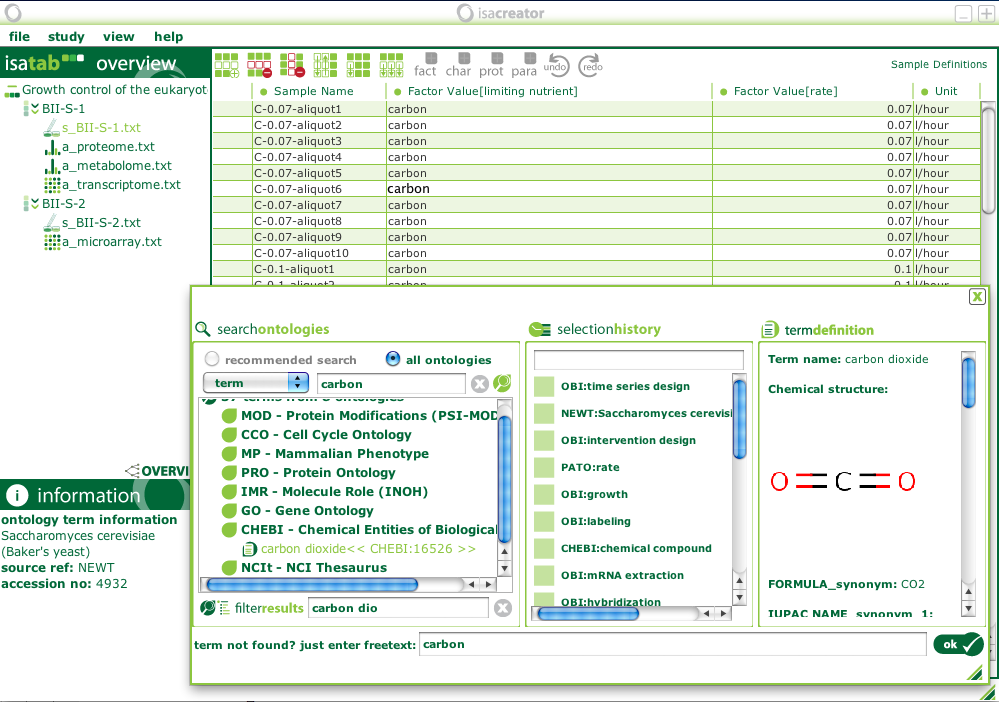
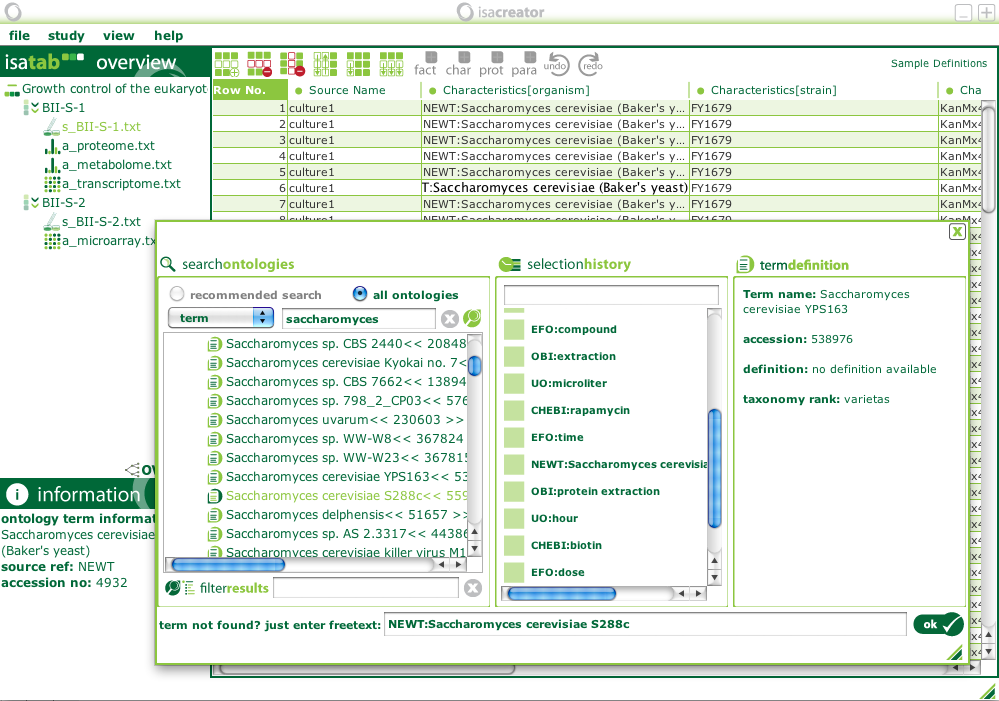
The user interface needs to be easy to use, and ontology selection should be seamless. The user needs not know which ontology resource they are browsing, but ontologies should be presented to them in a way which makes selection straightforward. ISAcreator achieves this by automatically prompting users for ontology terms whenever they are set to be required by the ISAcreator configurator.

Users are automatically prompted for Ontology terms

Users are presented with the full search result from both OLS and Bioportal in a standard form.

In summary, the functionalities inside both ISAcreator and it’s associated configurator make browsing and searching both OLS and BioPortal much simpler for users! An API with many advanced functionalities, building upon BioPortal and OLS services will be released soon as well as a standalone ontology browser and searcher!

Download ISAcreator and the ISAcreator configurator now from the ISAtab sourceforge site!